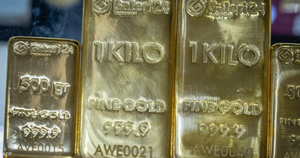



Gold’s Rate Shock
Gold Futures (GC1!) is trading at $4,128.05, down 0.31%, as of October 7, 2026, 3:59 PM EDT. The contract opened at $4,192.60, reached $4,197.72, and fell to $4,091.40.
The latest coverage points to one dominant force: higher Treasury yields are overpowering traditional safe-haven demand.
The Headlines Moving Gold
- Fed minutes reinforce a hawkish path. Most policymakers still see another rate hike by year-end. The September meeting produced a 25-basis-point increase, lifting the federal-funds target range to 3.75%–4.00%. Gold futures fell roughly 1.8% to $4,113.76 in the October 6 report
- The 10-year yield remains the market’s steering wheel. U.S. 10Y yields climbed toward 5.345%, pressuring gold from around $4,170 to $4,117 during October 7 trading.
- China’s central bank continues buying. Official-sector purchases offered brief support near $4,130, but the bid did not survive the European open. China’s Golden Week holiday also removed a major source of private-sector physical demand.
- Speculative positioning is weakening. Money managers reduced net bullish COMEX futures positioning for a fifth consecutive week, suggesting liquidation—not physical-market stress—is driving much of the decline.
- No GC1!-specific press release surfaced. The recent catalysts are macroeconomic: Fed policy, yields, the dollar, China’s holiday, and futures positioning.
Price Pressure In Numbers
| Point in timeline | Price or range | Market signal |
|---|---|---|
| October 6, 2026 | December futures near $4,189.50 | Relief rally as yields eased |
| October 7 open | $4,192.60 | Sellers quickly rejected the rebound |
| October 7 intraday high | $4,197.72 | Resistance near $4,200 held |
| October 7 intraday low | $4,091.40 | Roughly $106 peak-to-trough decline |
| October 7, 3:59 PM EDT | $4,128.05 | Down 1.41% over one week |
| Current volume | 154,020 contracts | Futures activity snapshot |
| Open interest | 325,595 contracts | Positions remain substantial |
All current contract figures are as of October 7, 2026, 3:59 PM EDT. The historical figures come from the cited October 6–7 articles.
textCopy code$4,200 ┤        ● High $4,197.72
$4,190 ┤      ● Oct. 6 futures $4,189.50
$4,150 ┤
$4,128 ┤                          ● Current
$4,100 ┤                    ● Low $4,091.40
Technical Damage
The daily setup remains bearish, but not yet deeply washed out:
- RSI: 37.02, bearish but above classic oversold territory.
- MACD histogram: -17.23, showing negative momentum.
- Daily Stochastic: 12.60, oversold.
- Daily ADX: 23.02, indicating a developing trend rather than an extreme trend.
- Price remains below the daily 10-, 20-, 50-, 100-, and 200-period moving averages.
The weekly picture is also weak, with RSI at 42.14 and weekly MACD still negative. The key complication is that short-term oscillators are oversold while the broader trend remains downward.
The Levels That Matter
The October 7 analysis identified:
- $4,101.35: first nearby support.
- $4,200–$4,205: initial resistance and broken-trendline zone.
- $4,230.51: 61.8% retracement resistance.
- $4,298–$4,334: moving-average resistance cluster.
David Morrison of Trade Nation described the decline as another setback for bulls after the prior rally.
WarrenAI Take
Bearish near term, structurally conflicted longer term. Rising yields and a firmer dollar are creating immediate pressure, while central-bank buying provides a slower-moving floor. The tape is not signaling capitulation yet: gold fell even as geopolitical risks and equity weakness could normally support safe-haven demand.
A sustained recovery would need yields to retreat, the dollar to weaken, and GC1! to reclaim $4,200–$4,230. Until then, oversold readings may produce a bounce, but the dominant trend remains lower. 📉
This content is for informational purposes only and not investment advice.