


Live Gold and Silver Prices Today: Spot Rates & Market Insights
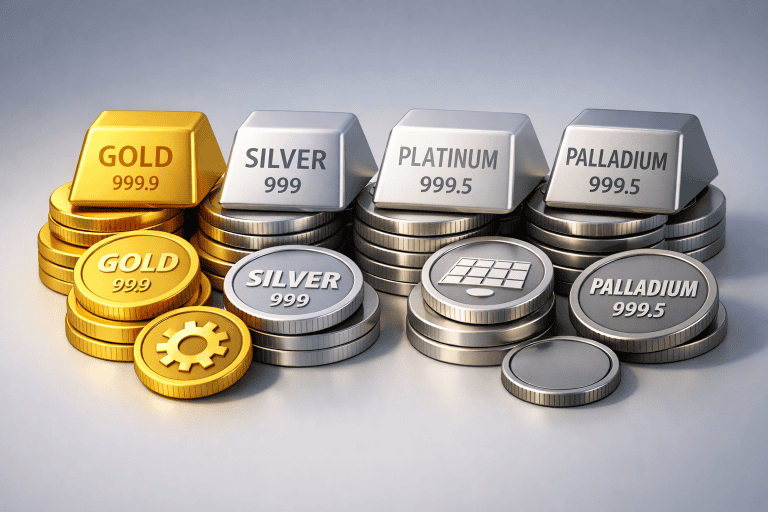
Gold and silver prices are moving targets, shaped by global trading, currency shifts, investor demand, industrial use, and the real-world costs of buying physical metal. If you are checking the gold and silver price today, the most useful approach is to look at the live spot quote first, then compare it with the actual buy or sell price offered by dealers, brokers, or trading platforms. This guide explains what the numbers mean, why they change, and how to use them without confusing spot price with your final transaction cost.

What is the current price of gold and silver?
As of October 7, 2026, Kitco showed gold at about $4,119.70 per troy ounce and silver at about $59.77 per troy ounce in U.S. dollars, with both pages describing their quotes as live spot-market prices that update frequently during trading hours. Because live gold and silver prices can move within seconds, any answer to “how much is gold and silver today” should be treated as a timestamped snapshot rather than a fixed daily number. For the most accurate gold and silver price today, check a live gold and silver rate page right before you buy, sell, or place an order.
That distinction matters because precious metal prices today are not like a store shelf price. The quote you see on a precious metal prices chart today reflects active market pricing, while your executed price depends on timing, product type, bid-ask spread, quantity, payment method, and dealer premium. A silver coin, for example, may cost more than its metal value because it has fabrication, handling, and distribution costs built in.
The spot price is the market reference point
The spot price is the current wholesale-style reference price for immediate market settlement of a metal, usually quoted per troy ounce in U.S. dollars. Spot gold and silver prices are influenced by continuous trading across global markets, including futures and over-the-counter activity. CME Group describes its precious metals markets as providing electronic access, liquidity, transparency, and central price discovery across gold, silver, platinum, and palladium products.
For everyday investors, spot is best understood as the baseline. It is not automatically the price you will pay for a minted coin, small bar, round, or collectible piece. The spot quote tells you where the raw metal market is trading; the retail quote tells you what it costs to acquire a specific item in a specific form.
A practical way to read any quote is to separate three layers:
- Spot price: the market reference price for the metal itself.
- Bid and ask: the prices at which market participants are willing to buy or sell.
- Premium: the amount above spot charged for fabrication, distribution, inventory risk, insurance, dealer margin, and product demand.
When comparing products, calculate the premium as a percentage of the metal value rather than only as a dollar amount. A small bar, a sovereign coin, and a large bar may all contain precious metal, but their total costs can differ significantly because the production and retail economics are different.
Why prices move throughout the day
Gold and silver trade in a global market, so the 24 hour gold and silver prices you see on a chart can respond to news while many local coin shops are closed. A change in the U.S. dollar, bond yields, inflation expectations, central-bank policy, geopolitical risk, or equity-market stress can quickly shift investor appetite for metals. World Gold Council research frames gold’s drivers around themes such as currencies, inflation, interest rates, consumer demand, market risk, investment flows, and supply factors.
Gold is often watched as a store of value and portfolio diversifier. When investors worry about currency weakness, financial instability, or geopolitical tension, gold demand can rise. On the other hand, when interest-bearing assets look more attractive, some investors may reduce exposure because gold does not pay interest.
Silver shares some of gold’s investment characteristics, but it also has a stronger industrial side. The Silver Institute has highlighted silver’s use across industrial applications and has described investment demand, industrial demand, jewelry, silverware, and supply balances as important parts of the market picture. That mix helps explain why silver can move with gold during broad precious-metals rallies yet swing more sharply when industrial-demand expectations change.
Gold and silver often move together, but not identically
Gold and silver are both monetary metals in the eyes of many investors, but they do not behave the same way. Gold tends to be more closely associated with central-bank activity, reserve demand, currency concerns, and defensive investing. Silver is pulled between investment demand and industrial consumption, which can make its price action more volatile.
One useful comparison is the gold-to-silver ratio. The ratio shows how many ounces of silver it takes to equal one ounce of gold. GoldPrice.com reported a gold-silver ratio close to 67.9 for October 7, 2026, meaning gold was priced at roughly 67.9 times silver on a per-ounce basis at that point. (goldprice.com)
The ratio does not tell you what to buy by itself. It can, however, help you see whether silver looks historically expensive or inexpensive relative to gold. If the ratio rises sharply, silver has weakened versus gold or gold has strengthened faster; if it falls, silver has outperformed gold. Investors sometimes use this as one input alongside trend, liquidity needs, storage costs, tax considerations, and risk tolerance.

How spot prices become real buy and sell prices
The price on a live chart is not always the price in your cart. Physical bullion generally trades above spot when you buy and below or near spot when you sell, depending on product demand, market conditions, and the dealer’s spread. That gap is not automatically unfair; it is part of how physical metals move from refiner to mint, distributor, dealer, and buyer.
The bid-ask spread is especially important. The bid is what a buyer is willing to pay, while the ask is what a seller is willing to accept. The tighter the spread, the less price friction there is; the wider the spread, the more the metal must move in your favor before you break even.
Before acting on live gold and silver prices, compare the complete transaction:
- Start with the current spot price. Use a trusted live source and note the timestamp.
- Check the product’s metal content. Confirm whether the item is one troy ounce, fractional, sterling, 90% coinage, or another purity.
- Calculate the premium. Compare the all-in price with the melt value based on spot.
- Review the buyback price. A low purchase premium is less useful if resale terms are weak.
- Include shipping, insurance, storage, and payment fees. These can change the true cost of ownership.
This process is more useful than simply asking, “what is the current price of gold and silver?” The better question is: “What is the current spot price, and what is my total cost or net sale price after spreads and premiums?”
Charts turn noisy price action into context
A precious metal prices chart today can show whether gold or silver is rising, falling, or consolidating during the current session. Short-term charts are useful for timing, but they can also make normal price movement feel dramatic. A one-minute chart may look chaotic even when the daily trend is modest.
Use several time frames together. The live chart helps you avoid buying immediately after a sudden spike. The daily chart shows whether the move is part of a broader trend. A multi-month or multi-year chart gives context for whether current pricing is high, low, or mid-range relative to recent history.
For practical decisions, consider tracking:
- Intraday direction: whether buyers or sellers are in control today.
- Recent highs and lows: areas where price has repeatedly reacted.
- Dollar strength: because metals are commonly priced in U.S. dollars.
- Real yields and rate expectations: because they affect the appeal of non-yielding assets.
- Gold-to-silver ratio: a quick view of relative value between the two metals.
Charts do not predict the future with certainty. They help you slow down, compare today’s price with recent behavior, and avoid making a decision based only on a headline or a single quote.
Practical takeaways for buyers, sellers, and watchers
If you are buying physical metal, focus less on calling the perfect bottom and more on controlling avoidable costs. Compare several reputable sellers, favor transparent pricing, and know your exit path before you buy. If you are trading paper exposure, such as futures, ETFs, or contracts for difference, spreads, liquidity, margin rules, and volatility matter more than storage or coin premiums.
If you are selling, check both spot gold and silver prices and real buyback bids. A dealer may advertise a strong retail price but offer a much lower purchase price for the same product. The number that matters is the amount you can actually receive after fees, shipping, assay requirements, or minimum transaction rules.
A simple checklist can help:
- Check the live gold and silver rate before requesting a quote.
- Compare at least two live sources if prices are moving quickly.
- Write down the spot price, dealer price, premium, and buyback bid.
- Avoid judging value by face value, packaging, or marketing language alone.
- Keep records of purchase date, metal content, premium, and total cost.
The bottom line
Gold and silver prices are best read in layers: live spot quote first, then spread, premium, product type, and your personal objective. Today’s market snapshot can answer “how much is gold and silver today,” but it cannot tell you whether a specific coin, bar, or trade is a good deal without the full transaction cost. Use live data, compare quotes carefully, and let charts provide context rather than emotion-driven urgency.